Homebuilder Stocks Surge After Housing Starts Jump 5.2% Despite Building Permits Falling to Five-Year Lows
NEW YORK — Tuesday morning's economic data release delivered an unexpected jolt to housing markets. The Census Bureau reported that U.S. housing starts jumped 5.2% in July to a seasonally adjusted annual rate of 1.428 million units, with single-family starts climbing 2.8% to 939,000 units—both figures exceeding analyst expectations for a decline and marking the strongest construction pace in five months.
The surprise triggered immediate gains across homebuilder stocks. By market close, the S&P Composite Homebuilder Index had risen 1.5% to reach its highest level since December 11, 2024. Home Depot led individual gainers with a 3.17% advance, while major builders posted solid increases: Lennar up 2.15%, D.R. Horton gaining 1.79%, LGI Homes rising 1.88%, KB Home advancing 1.72%, and PulteGroup climbing 1.68%.
Yet the celebration masked a troubling contradiction embedded within the same data release. Building permits—the forward-looking indicator that typically signals future construction activity—fell 2.8% to 1.354 million units, reaching five-year lows. This divergence between current production and future pipeline activity would define not just Tuesday's trading session, but the broader questions facing America's housing recovery.
The Architecture of Optimism
Today when the Census Bureau released July's construction data, seasoned traders encountered a familiar paradox. Housing starts had reached a seasonally adjusted annual rate of 1.428 million units—the strongest pace in five months, defying economist predictions of decline. Yet building permits, the forward-looking indicator that typically illuminates construction's future path, fell 2.8% to 1.354 million units, marking five-year lows.
"The market is essentially receiving mixed signals," observed a senior portfolio manager who specializes in real estate securities and requested anonymity due to institutional policy. "We're seeing production accelerate while pipeline visibility deteriorates—it's the kind of data pattern that creates both opportunity and risk."
This duality would define Tuesday's trading session, as investors parsed numbers that simultaneously supported bullish and bearish housing narratives.
Home Depot emerged as an unlikely catalyst, surging 3.17% after reaffirming full-year guidance despite mixed quarterly performance. The retail giant's steadfast outlook provided crucial validation for an ecosystem increasingly dependent on consumer confidence in an uncertain economic environment.
Among pure-play builders, the response was uniformly positive yet notably measured. Lennar advanced 2.15% to $134.25, while D.R. Horton climbed 1.79%. LGI Homes gained 1.88%, and industry stalwarts KB Home and PulteGroup posted advances of 1.72% and 1.68%, respectively.
The S&P Composite 1500 Homebuilding Index performance, showing the recent rally mentioned in the article.
| Date | Open | High | Low | Close/Last |
|---|---|---|---|---|
| 08/07/2025 | 2,367.35 | 2,409.96 | 2,353.05 | 2,356.96 |
| 08/06/2025 | 2,363.86 | 2,379.50 | 2,343.17 | 2,343.96 |
| 08/05/2025 | 2,322.04 | 2,387.01 | 2,322.04 | 2,358.24 |
| 08/04/2025 | 2,275.49 | 2,326.94 | 2,274.82 | 2,321.49 |
| 08/01/2025 | 2,227.89 | 2,278.57 | 2,221.15 | 2,272.34 |
The Rate Equation
The 30-year fixed mortgage rate's decline to approximately 6.58%—the lowest level since October 2024—provided the rally's fundamental underpinning. This improvement represents more than statistical movement; it embodies the Federal Reserve's ongoing recalibration of monetary policy and its ripple effects through rate-sensitive sectors.
Trend of the 30-year fixed mortgage rate in the U.S., illustrating the recent decline that has supported the housing market.
| Date | Average 30-Year Fixed Mortgage Rate |
|---|---|
| August 19, 2025 | 6.64% |
| August 14, 2025 | 6.58% |
| August 7, 2025 | 6.63% |
| January 2021 | 2.65% |
For prospective homebuyers, each basis point decline translates to meaningful monthly payment reductions. For builders, lower rates reduce the cost of incentive packages designed to stimulate demand. Yet the rate remains elevated by historical standards, creating what industry observers describe as a "goldilocks challenge"—finding the precise level that stimulates activity without reigniting inflationary pressures.
A basis point is a standard unit of measure in finance equal to one-hundredth of a percentage point (0.01%). This precise term is used to describe changes in interest rates and other financial instruments, where an increase of 100 basis points is equivalent to a 1% change.
Tuesday's market action reflected broader portfolio repositioning as investors rotated away from technology megacaps toward defensive and cyclical names. The Nasdaq's 1.5% intraday decline contrasted sharply with gains across rate-sensitive sectors, illustrating how monetary policy expectations drive modern portfolio construction.
Beneath the Surface: A Market Under Pressure
The celebration, however, obscured mounting structural pressures that threaten to constrain future performance. Industry data reveals that 66% of homebuilders currently offer incentives to attract buyers—a substantial increase that reflects challenging demand conditions despite improved construction metrics.
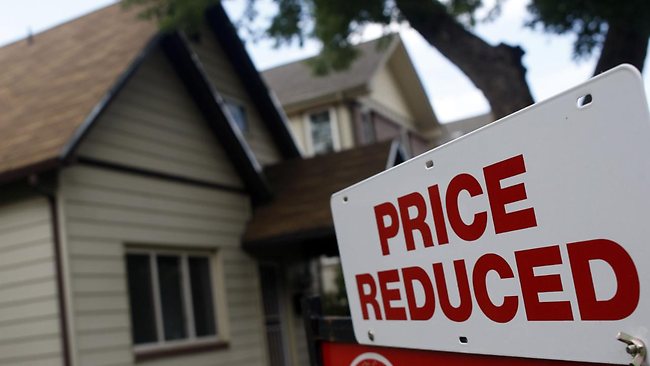
More concerning, 37% of builders have implemented outright price cuts, suggesting that market dynamics have shifted fundamentally from the pandemic-era seller's market. This promotional intensity creates a dangerous dynamic: improved unit volumes achieved through margin compression.
Material cost inflation compounds these challenges. While lumber futures have retreated from extreme peaks, copper and other construction inputs remain elevated compared to year-earlier levels. The combination of pricing concessions and input cost pressures creates what one industry analyst described as "a profitability vise that's tightening even as volumes stabilize."
Builder sentiment, as measured by the National Association of Home Builders' Housing Market Index, remains mired at 32—marking the 16th consecutive month below the critical 50 threshold. This persistent pessimism among industry participants contrasts starkly with equity market enthusiasm, creating a disconnect that sophisticated investors monitor closely.
The NAHB/Wells Fargo Housing Market Index (HMI). A reading below 50 indicates that more builders view conditions as poor than good.
| Month/Year | HMI Value |
|---|---|
| August 2025 | 32 |
| July 2025 | 33 |
| June 2025 | 32 |
The Permit Paradox
Perhaps most troubling is the permit data's implications for 2026 construction activity. The 2.8% decline was particularly pronounced in multifamily permits, suggesting developers remain deeply skeptical about demand sustainability. Single-family permits showed modest resilience, but the overall trajectory indicates widespread caution about committing capital to future projects.
"Permits are where builders put their money where their mouth is," explained a real estate investment strategist. "The disconnect between starts and permits suggests we're seeing a temporary production surge against deteriorating forward visibility."
A chart comparing U.S. housing starts (current activity) and building permits (future activity), highlighting the recent divergence.
| Month | Housing Starts (Seasonally Adjusted Annual Rate) | Building Permits (Seasonally Adjusted Annual Rate) |
|---|---|---|
| July 2025 | 1,428,000 | 1,354,000 |
| June 2025 | 1,358,000 | 1,393,000 |
| May 2025 | 1,277,000 | 1,386,000 |
This dynamic creates what economists term a "pipeline risk"—the possibility that current construction gains cannot be sustained without a meaningful improvement in permit activity. For investors, it represents the difference between a cyclical upturn and a statistical anomaly.
Strategic Positioning in Uncertain Times
For professional investors, Tuesday's action illuminated both opportunities and risks that extend beyond momentum trading. The divergence between production metrics and forward indicators suggests a market in transition rather than clear directional acceleration.
Scale production builders with captive mortgage operations appear best positioned to navigate current conditions. Companies like Lennar and D.R. Horton possess the financial flexibility to offer rate buydowns while maintaining operational efficiency. Their ability to trade pace against price—accelerating sales through strategic concessions—provides competitive advantages in a margin-pressured environment.
Conversely, entry-level specialists face heightened execution risk. While these companies typically exhibit the highest operating leverage to improving fundamentals, their vulnerability was recently demonstrated when LGI Homes reduced guidance amid what management termed "visibility challenges."
Building products companies present perhaps the most nuanced opportunity. Volume-sensitive suppliers could benefit from sustained construction activity, yet lumber price deflation and metals volatility create revenue headwinds. Installation-heavy business models appear preferable to commodity-sensitive distributors in the current environment.
The Federal Reserve Factor
Ultimately, the Federal Reserve's policy trajectory remains the decisive variable for sector performance. Market participants are pricing in potential rate cuts that could drive mortgage rates toward 6.25%—a level that historical analysis suggests could meaningfully stimulate housing demand.

Yet this outlook faces multiple risks. Jackson Hole symposium commentary could signal less dovish Fed intentions, while persistent inflation or evolving trade policies might constrain monetary easing flexibility. Any reversal in the mortgage rate trend would likely pressure the rate-sensitive homebuilder complex.
The Jackson Hole Symposium is an annual economic conference hosted by the Federal Reserve Bank of Kansas City. At the event, central bankers, economists, and policymakers from around the world gather to discuss pressing economic issues. Speeches, particularly from the Federal Reserve Chair, are closely watched for insights into future monetary policy.
Looking Forward: The Data That Matters
September's economic calendar will provide critical confirmation of trend sustainability. New home sales figures and the next permits report will determine whether July's strength represents genuine inflection or statistical noise.
For investors, the homebuilder rally represents less a verdict than a hypothesis—one that coming weeks of data will either validate or refute. The sector's performance has become a proxy for broader economic confidence, making it a crucial barometer for portfolio positioning decisions.
As markets continue processing incomplete information in an era of profound uncertainty, Tuesday's homebuilder surge stands as a reminder that even positive data can mask complex underlying dynamics. The challenge for investors lies not in celebrating temporary gains, but in discerning sustainable trends from statistical fluctuations.
In the end, the numbers told two stories: one of immediate optimism, another of lingering caution. Which narrative ultimately proves correct will determine whether Tuesday's rally marked the beginning of recovery or merely another false dawn in a market still searching for stable footing.
Disclaimer: This analysis is for informational purposes only and should not be considered personalized investment advice. Past performance does not guarantee future results. Readers should consult qualified financial advisors before making investment decisions.